There are a lot of high-quality recommendations floating around the internet. But these recommendations are mostly unstructured and can be difficult to internalize.
One of my favorite applications of data analysis is structuring, aggregating and visualizing recommendations. I have gotten a lot of personal value out of it (every book from the Twenty Minute VC list has been good or great) and I hope others find it helpful too.
I recently discovered Patrick O’Shaughnessy’s podcast Invest like the Best and it is terrific. The episode with Eugene Wei is the best podcast episode I’ve listened to in at least a year:
One of the best podcast episodes I’ve listened to. Highly recommend https://t.co/T3M3hyfCkL
— Joe Hovde (@Jhovde2121) January 24, 2019
Patrick is active on twitter and crowdsources recommendations for books, people, blogs, etc. I decided to aggregate some of the recommendations and visualize them.
Books
These are book recommendations Patrick asked his followers for, weighted by number of “likes.” The Amazon links are affiliates; buying a book through them is a good way to buy me a cup of coffee.
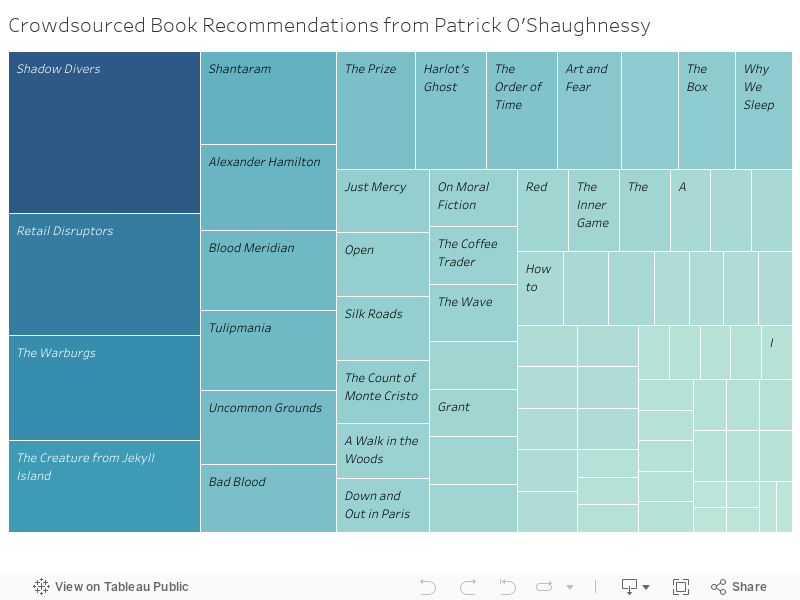
Twitter likes are not a perfect metric largely because they are heavily time-dependent; the earliest responses in get the most likes. But perhaps because of this, I am happy with how these recommendations turned out. It is refreshing not to see Sapiens dominate books that haven’t received as much hype.
The phenomenal Bad Blood is the only book in the top 10 that I have read. I work in retail tech and am excited to read Retail Disruptors. I have heard a lot about The Creature from Jekyll Island and reading it seems like a good way to disabuse myself of the notion that I understand the Federal Reserve.
Further down the list are several books I love:
- Why We Sleep, which changed how I think about sleeping.
- Red Notice, which is somehow thrilling, inspiring, topical and terrifying all at once
- A Gentleman in Moscow which is terrific fun and a good escapist novel
- Siddhartha and Man’s Search for Meaning which both address big questions about who we are and what we’re doing here
- The Count of Monte Cristo and Wind, Sand and Stars which speak to the francophile in me
I am curious about Shadow Divers and The Warburgs. If you’ve read and loved these or any of the other books on the list, let me know.
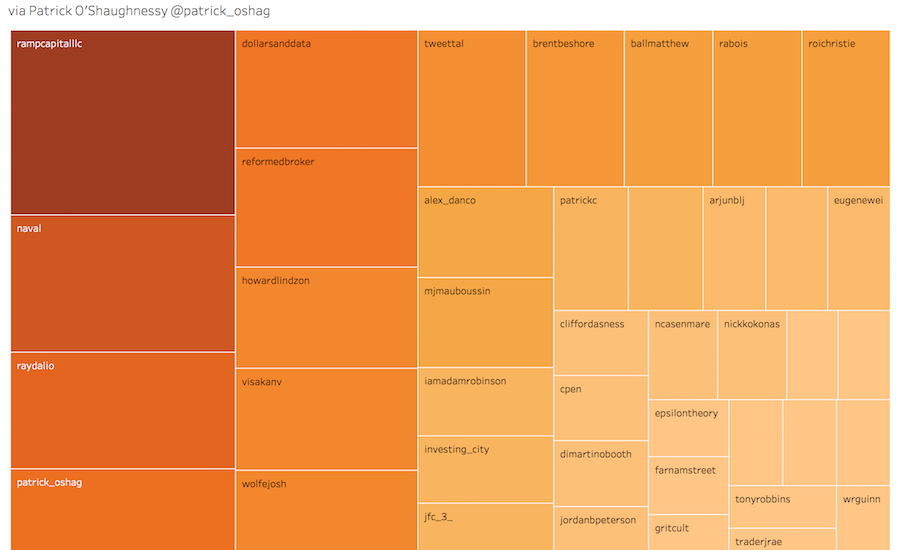
People
Next are the responses to Patrick’s question, “If you could draft anyone you follow on twitter into your company tomorrow, who would you draft?” weighted by number of “likes” for each recommended person.
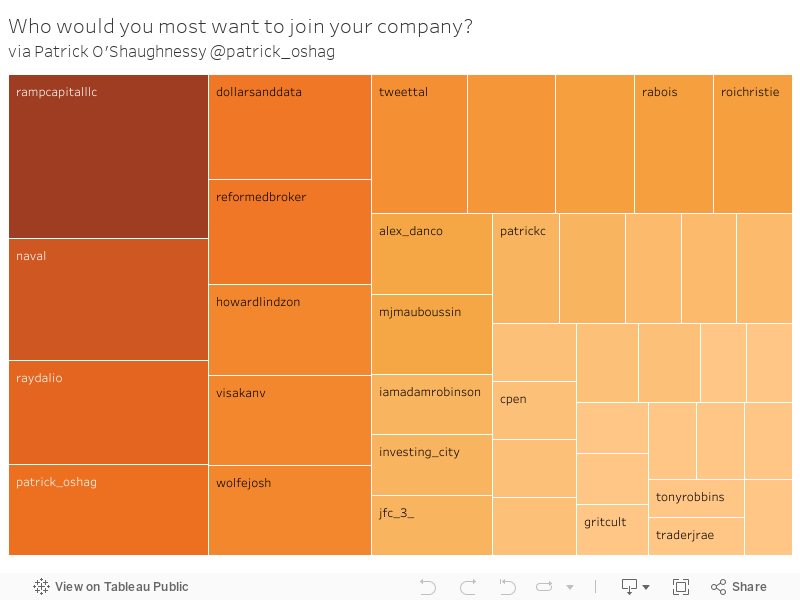
I gathered and analyzed the data in R and visualized it in Tableau. The code is on GitHub for anyone interested.
Thanks to Patrick for lending his audience for this and for his terrific podcast, which you should listen to.
Thanks for reading. If you’re interested in this sort of thing, sign up below and I’ll email you when I write a post.